Ethiopia Import Intelligence Dashboard 2025
የኢትዮጵያ ገቢ ንግድ ዳሽቦርድ 2025
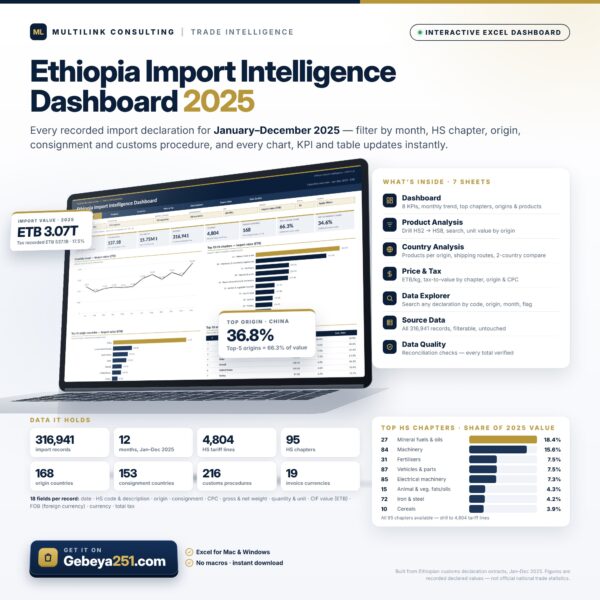
See exactly what Ethiopia imported in 2025: every product, every source country, every month, in US dollars and birr.
👉 Get it now on Gebeya251.com
Make decisions with real customs data
Ethiopia’s import market changed sharply in 2025. The birr was floated, fuel demand jumped and supply chains moved to new countries. This dashboard turns 2025 customs declarations into clear, interactive insight, so you can spot opportunities, size markets and track competitors in minutes rather than weeks.
Key findings from the 2025 data
$22.0 billion in imports, up 8.3% in US dollars. In birr they rose about 80%, mostly because the birr moved from about 56 to 156 per dollar.
China supplied 36.9% of all imports. It is by far Ethiopia’s largest source country.
Refined fuel was the largest single import: $3.89 billion (+43%). Supply shifted from Kuwait to the UAE and Saudi Arabia.
Fertiliser sourcing was reshaped. Morocco dropped out as a source, and Saudi Arabia filled part of the gap.
Tax rates moved on key goods. The effective rate on fuel rose from about 5% to 18%, and on sugar from about 17% to 38%.
What you get
Headline figures: total imports, duties and taxes, effective tax rate, weight and number of declarations, each compared with 2024.
Monthly trends: 2025 against 2024, with peaks and seasonal patterns.
Product analysis: top imports by product group and HS code, from chapter down to detailed lines.
Source countries: who supplies what, the country of origin versus the country goods were shipped from, and dependence on a few suppliers.
Strategic imports: fuel, fertiliser, wheat, edible oil, medicines, vehicles, machinery, electronics and construction materials.
Tax analysis: duties and taxes by product and customs procedure, with the highest and lowest effective rates.
Price versus volume: unit values (USD per kg) for key products, showing whether a change came from price or quantity.
Full filtering: filter by month, product, country and region, switch between birr and US dollars, and compare 2025 with 2024.
Who it’s for
Importers and distributors: size your market and see where competitors source their goods.
Manufacturers: find import-substitution opportunities backed by hard numbers.
Investors, banks and consultants: support feasibility studies, credit decisions and market entry.
Policymakers and researchers: track trade, tax revenue and supply risks.
Why this dashboard
Built from actual customs declarations, cleaned, standardised and checked against the raw totals.
Shows values in both birr and US dollars, so the exchange-rate effect is visible.
Ready to use straight away. No data cleaning and no technical skills needed.
Prepared by trade analysts at Multilink Consulting.
Format
An interactive dashboard plus an Excel workbook with pivot tables, filters, method notes and a data dictionary.
Get the full picture of Ethiopia’s 2025 imports today.
👉 Available now on Gebeya251.com
Multilink Consulting · Trade Analysis and Insight





Reviews
There are no reviews yet.